Let’s talk about variability. Many of you have correctly highlighted over the past few weeks that coffee absorption can be variable due to a variety of reasons. This not only occurs with coffee but with almost all drugs that we have on the market. The levels reported in the coffee simulator are based on a population average, meaning, this is the typical profile of the population that describes the data across all 59 individuals in the study best. To understand variability, we often test for covariates (independent variables that can influence the outcome). Knowing which covariates significantly affect our drug profile is important so we know which groups of people need dose adjustments.
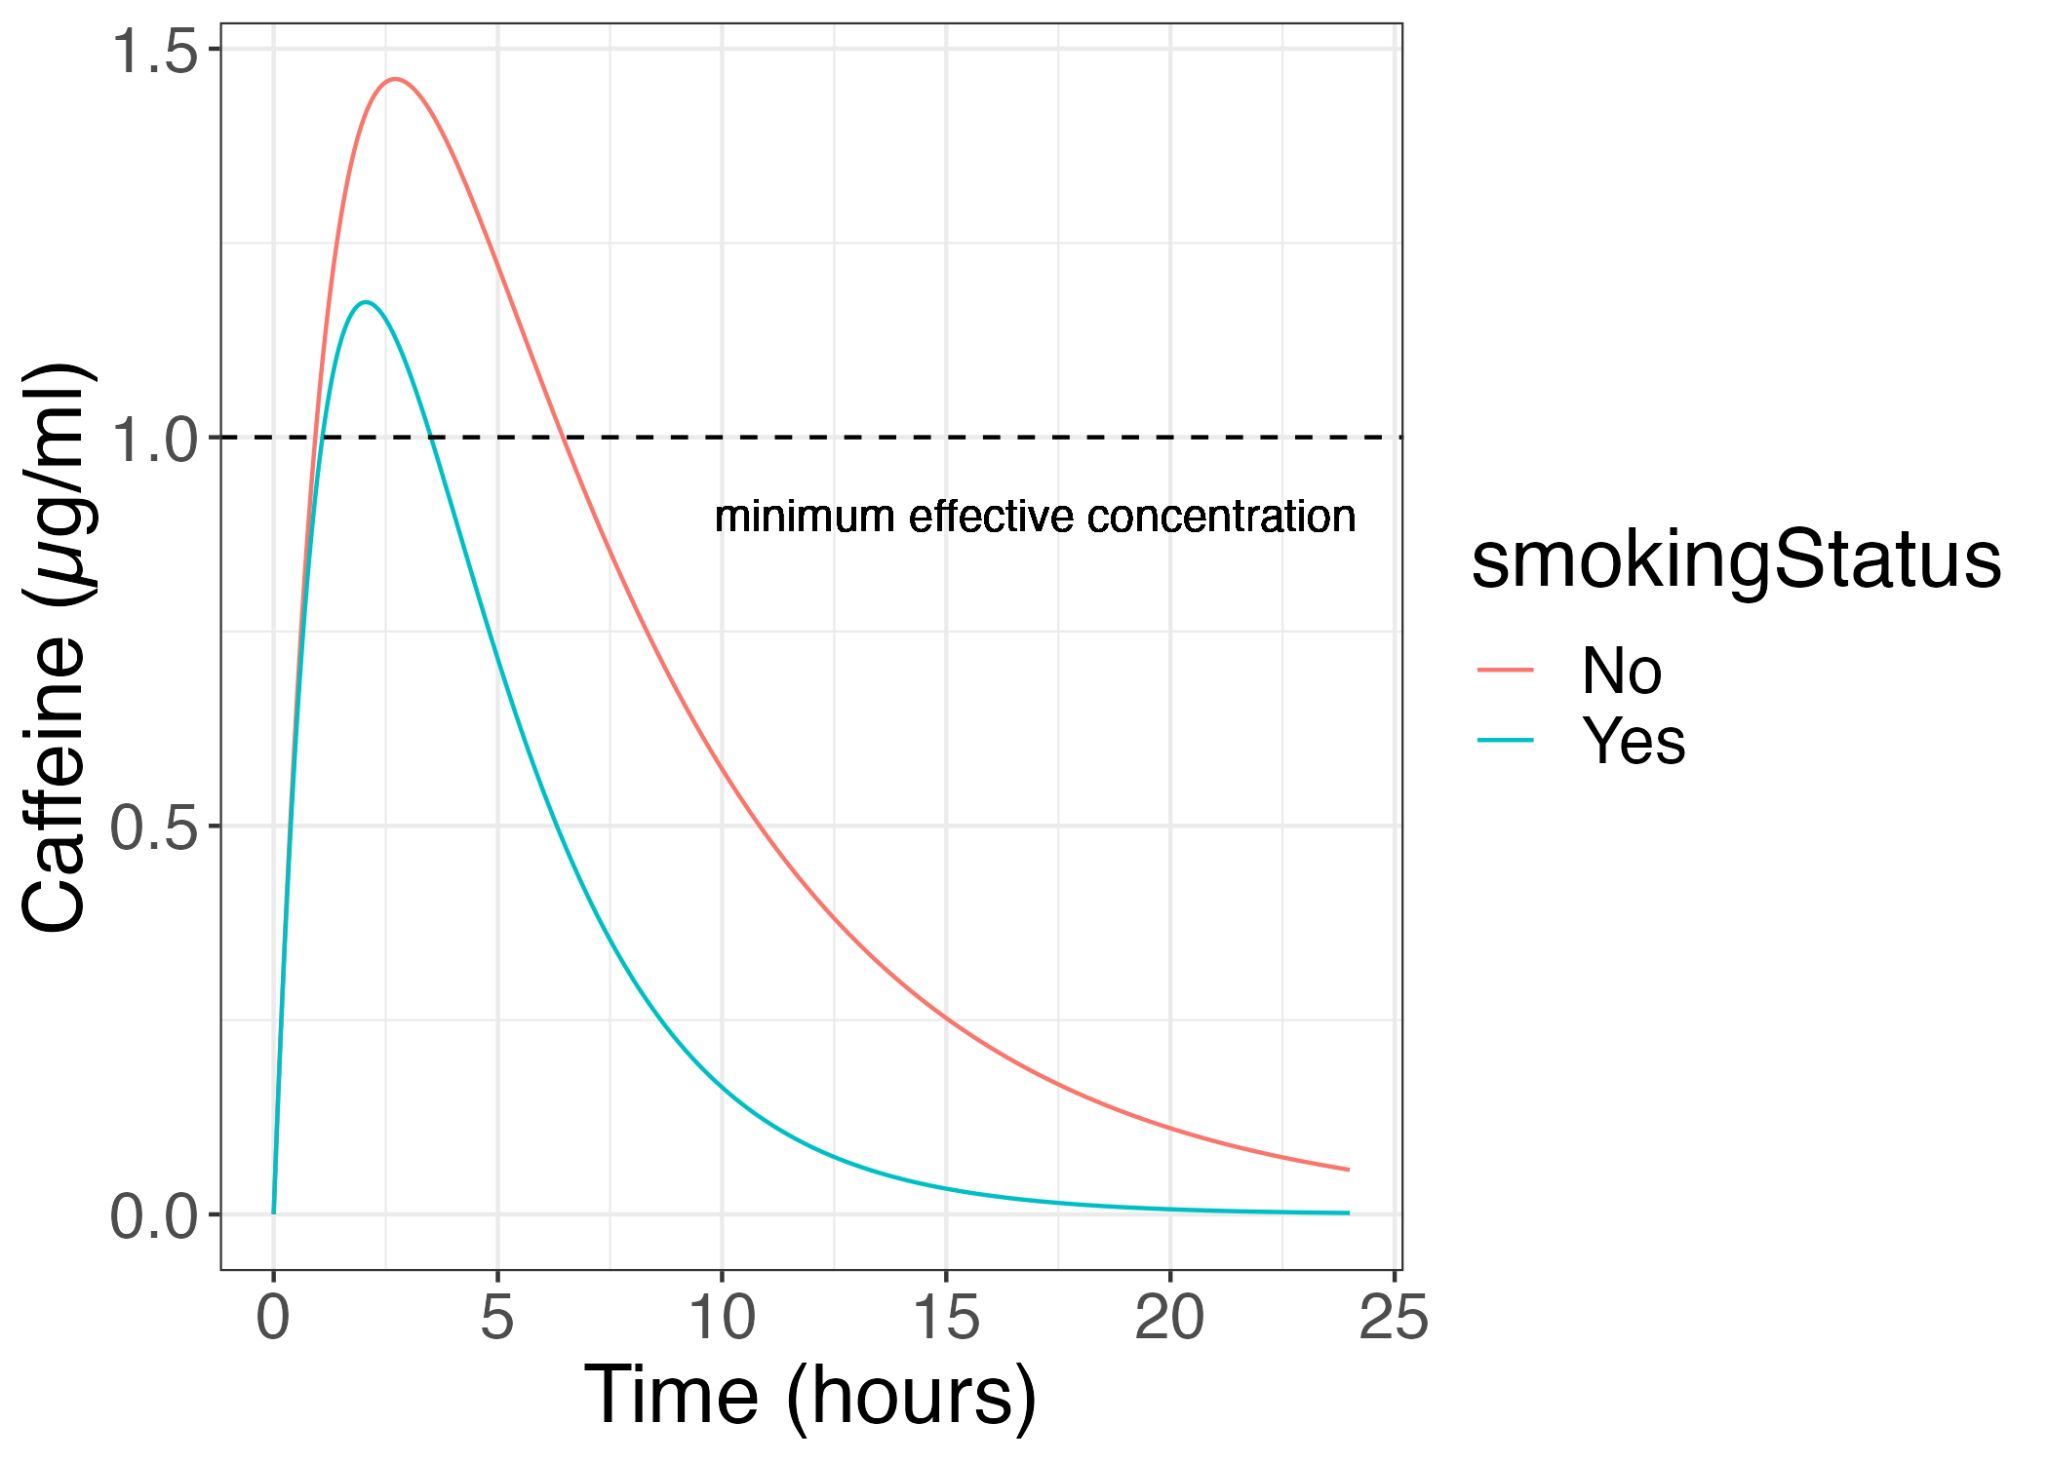
Covariates that we often test for include things such as age, weight, gender and genetic makeup. If you noticed in the app, there was an option for smoker or non smoker. This was the most significant covariate in the study. If you toggle between smoker and non-smoker, you will see that smokers tend to have a much lower caffeine concentration compared to non-smokers. This means that to get the same amount of benefits as a non-smoker, smokers will need to drink more coffee.
Now, this post is not meant to discuss the pros and cons of smoking. How exactly the paper arrived at this conclusion is purely a data-driven one. In this study, age, weight, history of regular caffeine consumption and smoking status were collected as participant information alongside the caffeine PK data. A base model, which describes the typical population PK profile is first built to get PK parameters such as rate of absorption (KA), clearance (CL) and volume (V). After, each of these covariates are tested against each of the parameters in a step-wise fashion, and the covariates that help explain PK variability the best are highlighted as significant covariates to be included in the model. This is usually evaluated as a drop in the objective function value (OFV), a measure of how well the model explains the data. The combination of covariates that caused the largest statistically significant drop in OFV is then selected as the model covariates. In the caffeine paper, smoking status alone resulted in this drop, while age, weight and caffeine consumption did not improve the model significantly. Hence we have an option for smoking and non-smoking in the app!
If you would like to go more in depth into understanding and modelling covariates, Prof Nick Holford has a good set of slides on the topic you can access here https://holford.fmhs.auckland.ac.nz/docs/principles-of-covariate-modelling.pdf
Stay tuned for our last and final part of this series where we discuss various real life applications of PK modelling!
I would love to hear from you too about topics you might want me to discuss, so leave your suggestions in the comments!