Hello fellow coffee and cat lovers, as with the first caffeine simulator, I will be going through how to run PK-PD simulations too.
Link to coffee simulator 2: https://lnkd.in/dAiS3igB
We have previously covered how to run PK simulations which you can view in my blog here. https://lnkd.in/gRhA62_T
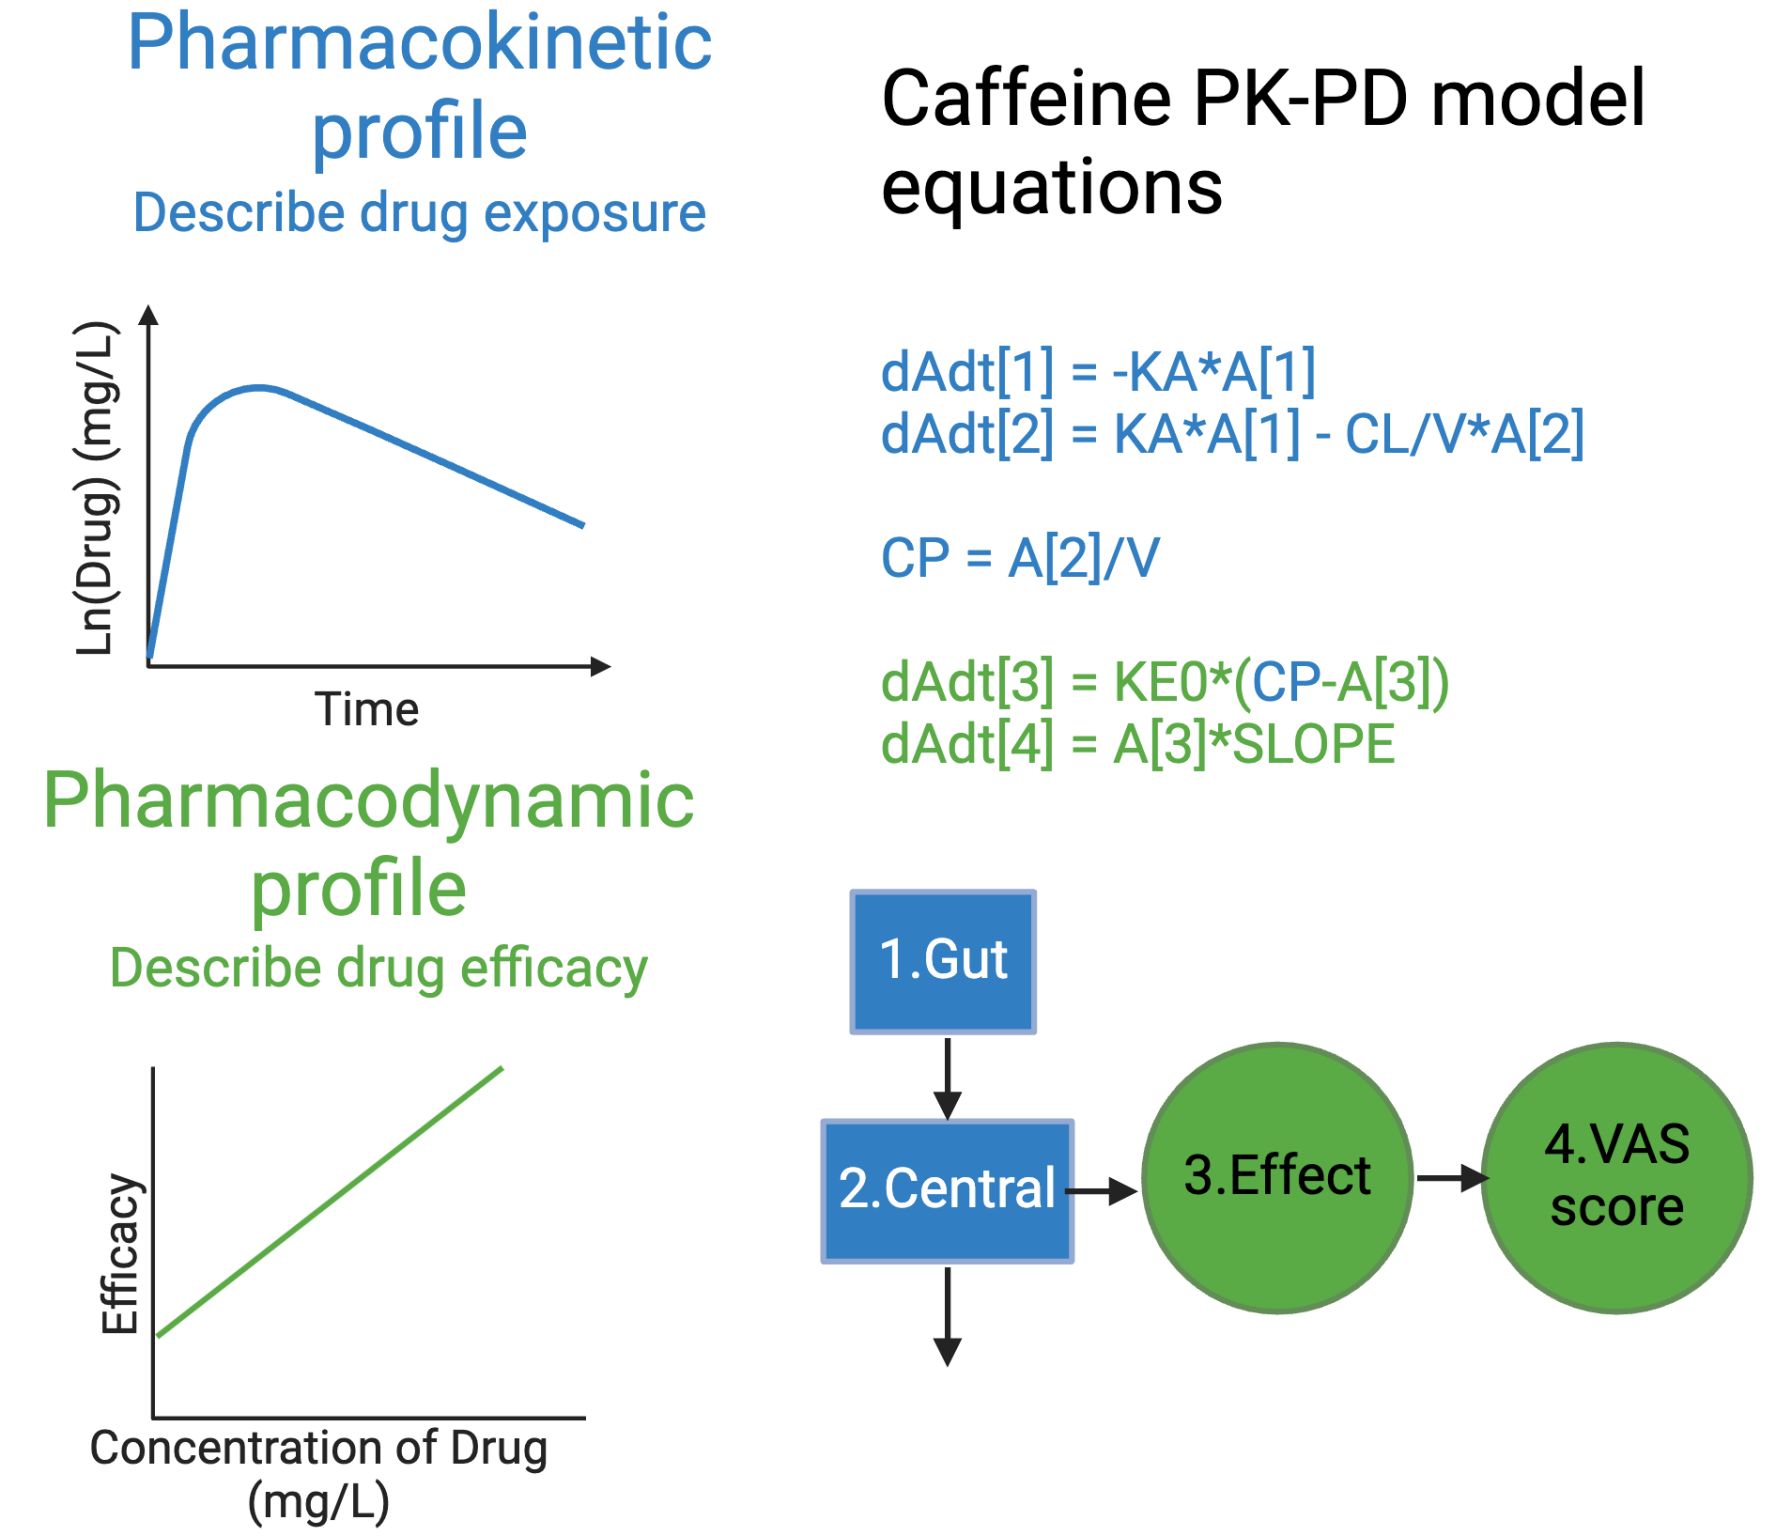
PK-PD models are an extension of that, where we derive a concentration-response relationship on top of the PK model to form our PD model.
For that, we need to measure the PD response over time. You can see this in the paper by RN Burns (DOI: 10.4236/pp.2014.54054), where they have measured both PK, and PD over a 4 hour period.
PD responses can be linked to PK through equations such as sigmoidal Emax, or slope (see picture). In this case, a slope was used as the caffeine doses tested did not reach a saturation point that would allow a sigmoidal Emax curve to be estimated. As caffeine’s effect was also a delayed one, i.e. we experience the benefits of caffeine a little later after we have drunk our coffee, an additional effect compartment was added as well to account for this delay.
The parameters of these PD equations are fit to the data to form our concentration-response relationship, and can then be used to model response at different concentrations.
Hope you learnt something in this post!