When you take a drug, the drug needs time to be absorbed after, it needs to reach the effect site and then cause a biological process to happen before an effect occurs. All these processes take time. Some of them are fast, allowing us to model drug effect directly in relation to the drug concentration profile (direct effect model). Other effects, like the one we observe in caffeine, are slower, having a delay between reaching peak drug concentration and peak effect concentration, and require us to model its effect as an indirect effect model.
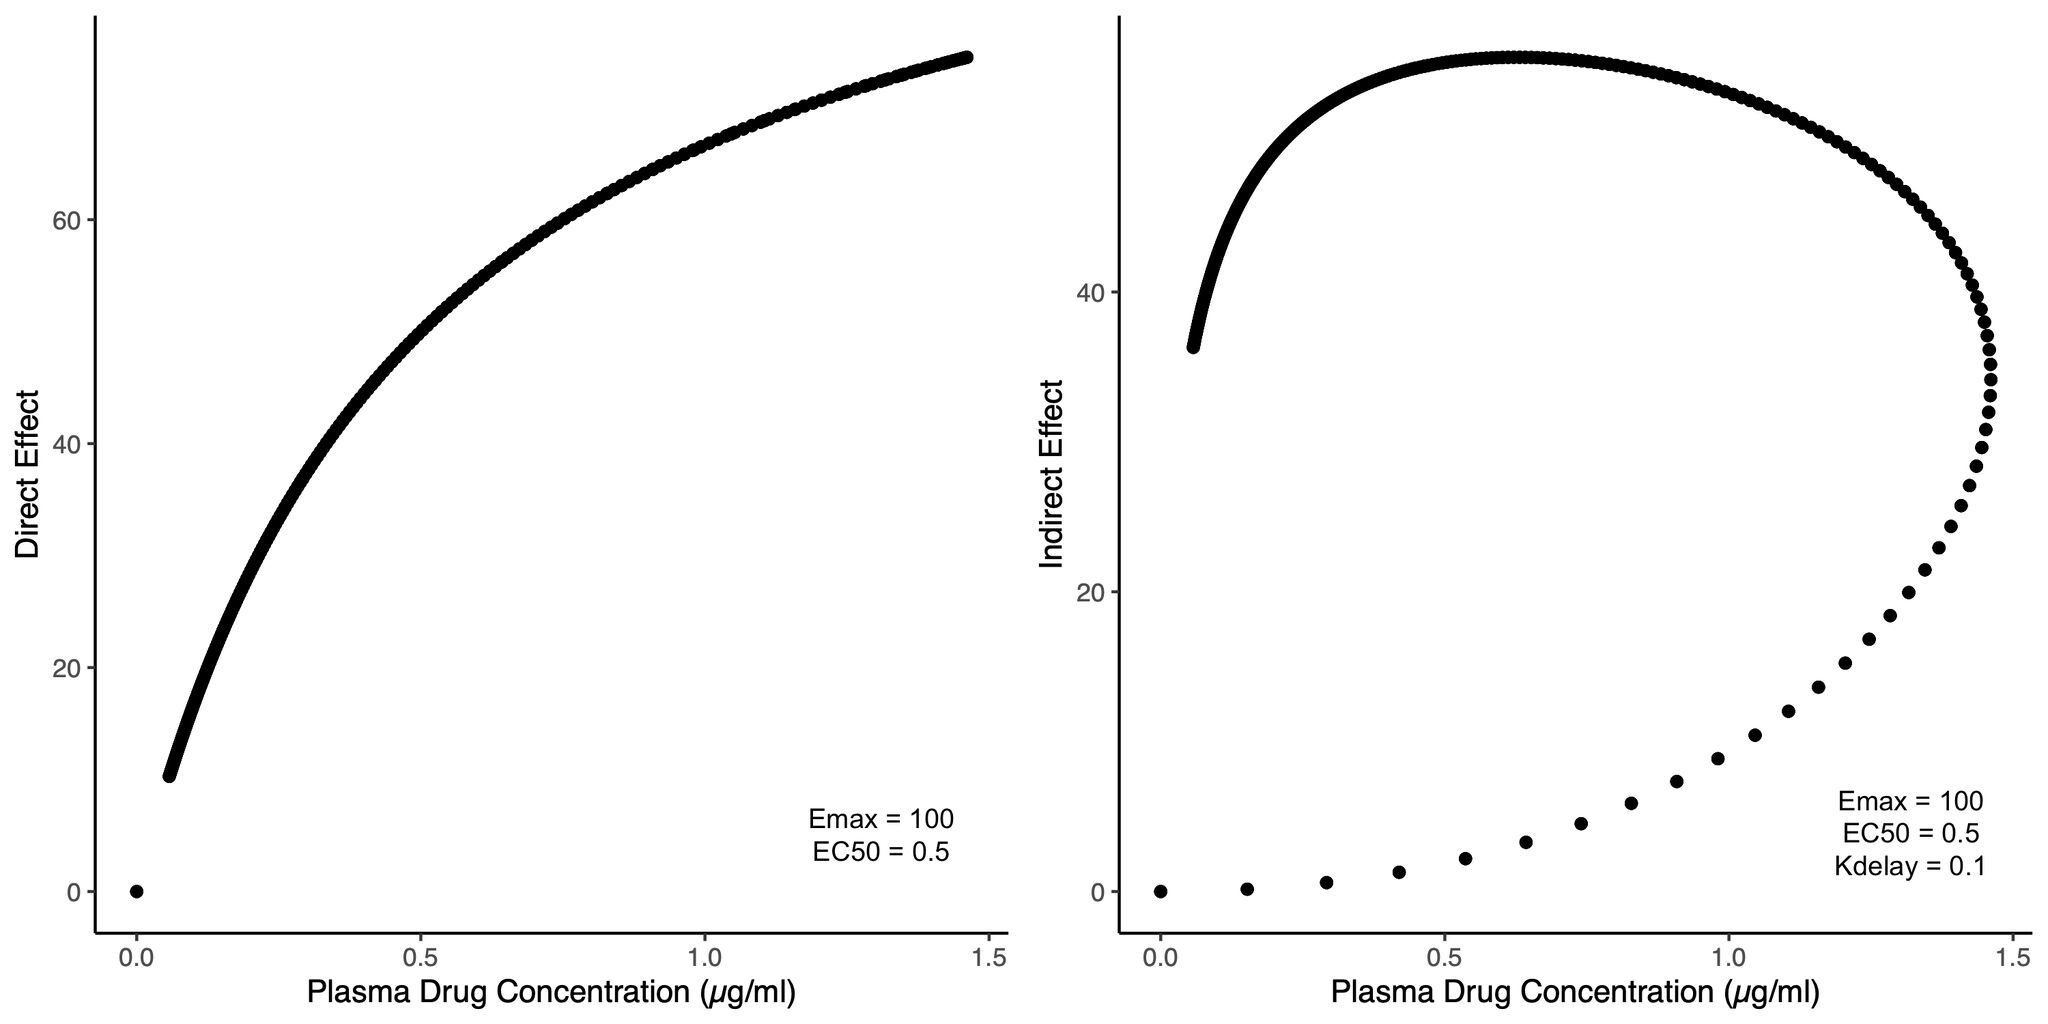
One of the interesting plots mentioned in the original caffeine PK/PD paper by RN Burns (DOI: 10.4236/pp.2014.54054) is this hysteresis plot mentioned in figure 1, correlating effect against drug concentration. This is a classic example of a diagnostic plot for indirect effect. In a direct effect model, a sigmoidal curve should appear instead (See figure in post. I used some arbitary PD parameters to generate these plots).
Other ways of testing for direct and indirect effect would be to simply test the model fits of both direct and indirect models on the data and observe which one results in a better fit and objective function value, as well as the magnitude of the Kdelay value which governs the delay effect.
Hope you learnt something this week too!