Nobel prize-winning neural nets and pharmacometrics

As a (mostly) computational scientist, I was excited to see both the Nobel prizes in physics and chemistry being awarded for computational work last week. In particular, the Physics price on Artificial neural networks, a fundamental building block in many artificial intelligence (AI) tools, was an exciting recognition. As the nobel prize website aptly puts it, artificial neural nets help us to independently discover properties in data by using neural net structures to process information. This opens up the possibility of discovering more trends e.g. non linear ones, that classical machine learning methods might struggle to work with. Allowing AI to handle the job further allows us to analyze large amounts of big data, which would have previously been impossible for humans to manually go through and analyze ourselves. It is thus no wonder AI has such a pervasive use today.

What about the use of AI in pharmacometrics?

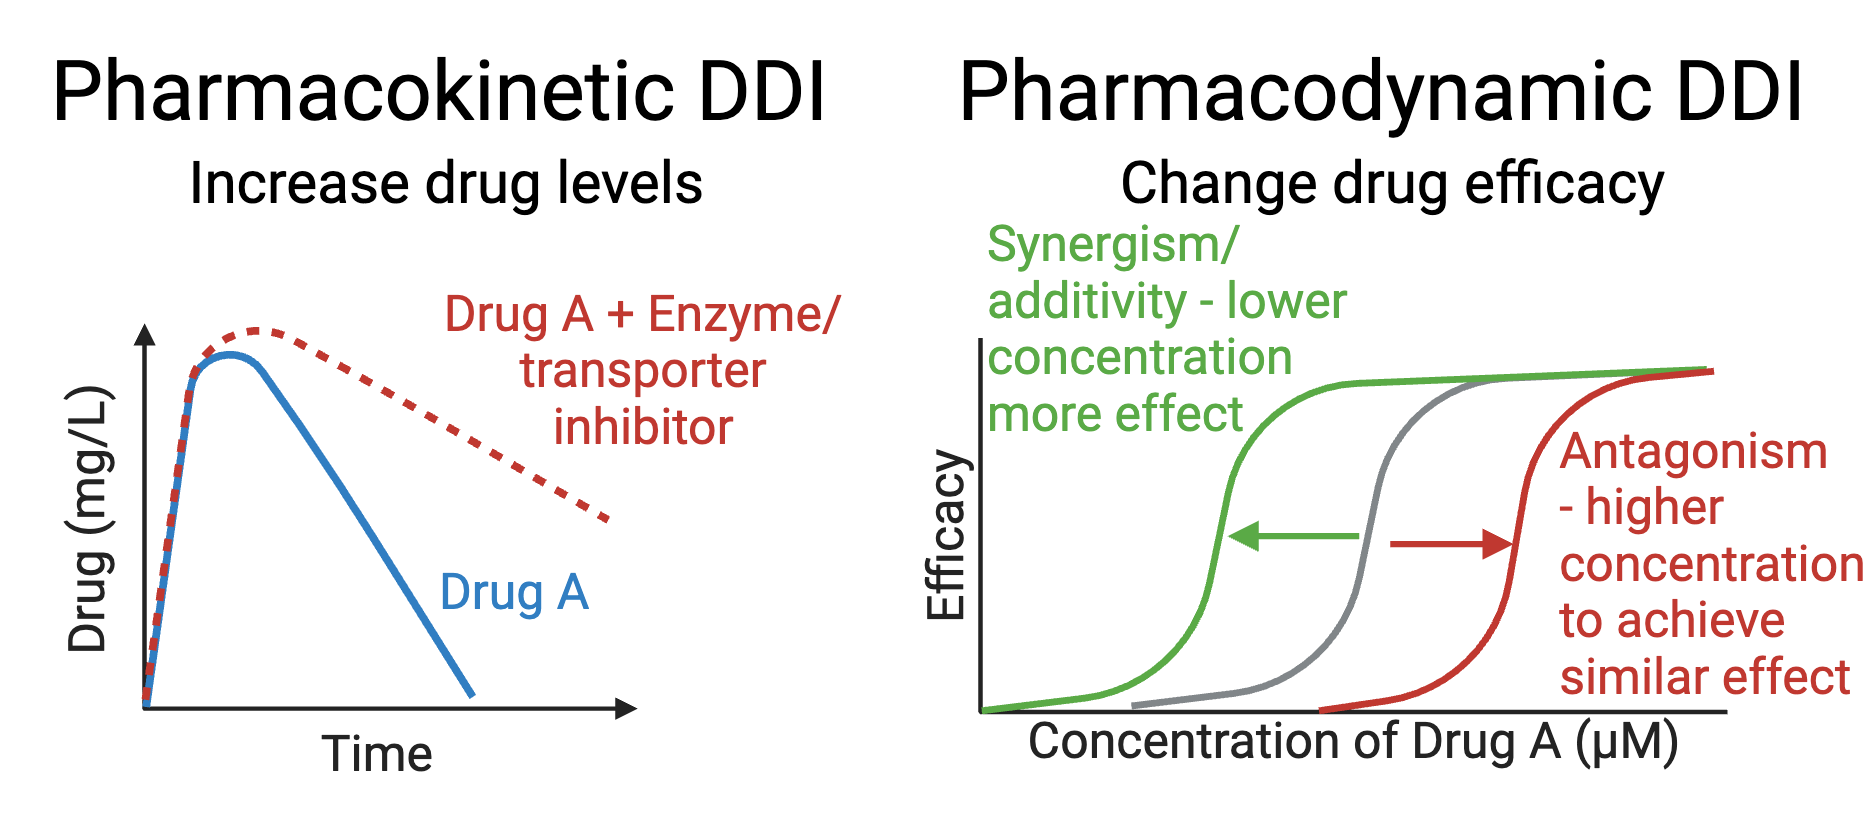
Much interest has come about in recent years merging pharmacometrics tools with AI. In literature today, tools have been developed promising to automate pharmacokinetic (PK) model building and prediction of new dosing regimens, integrate unstructured data as covariates in models, and even provide mathematical equations describing previously unknown relationships between trends, to name a few.

Does this mean that I am now out of a job and should pursue my grad school fever dream of opening a bakery or becoming a tik tok creator though?

Not really.

As British statistician George Box famously said, “All models are wrong, but some are useful.” Regardless of whether a model is being built by me or by an AI model, stringent evaluation of a model on its usefulness still applies, and findings that come out of these analyses still need to be critically evaluated using a scientific lens. And, as many science papers have concluded, further work and experimental evaluation always need to be done to fully confirm our hypothesis.

AI tools are thus unlikely to completely take over our jobs. Rather, they should be seen as an upgrade to complement traditional pharmacometrics tools, allowing us to work more efficiently and make even more exciting discoveries.

Posted in Uncategorized | Tagged , , , , , , , , , | Leave a comment

How can pharmacometrics benefit clinical practice and vice versa?

Last weekend, I had the privilege of speaking about my work in pharmacogenomics at the Singapore Pharmacy Congress. It was a good time of getting to meet old friends and network with the new generation of pharmacists.

Just as how pharmacokinetic (PK) modeling is useful in drug development to find new doses, PK modeling can be useful too in helping to stratify patients and tailor appropriate drug doses to their needs. In the era of precision medicine, there is a huge focus on pharmacogenomics (PGx). However, as mentioned in a morning session on PGx, any good pharmacist would know that PGx alone cannot answer the full story of drug exposure. Factors such as age, weight and renal clearance can also significantly impact drug exposure. PK models can also incorporate mixed effects, allowing us to model the impact of all these factors together to make a more holistic decision about the appropriate dosing for a patient.

My fellow clinical pharmacists in turn educated me on the challenges of implementing PGx in the clinical setting, as well as the need to evaluate the cost-benefit of pre-emptive PGx testing. A medication with a wide therapeutic index that can be titrated slowly for a chronic condition might not benefit as much from PGx testing as a medication for an acute condition such as a serious infection, where the appropriate dose needs to be given right away. Many other challenges in evaluating cost of PGx testing and the need to prioritize only the important drug-gene alerts come in to play too. It was indeed enlightening to learn more about what was happening in the hospitals.

Posted in Uncategorized | Tagged , , , , , , , , | Leave a comment

A quick visual check for saturated clearance


In many animal studies, a wide range of doses are often used. At high doses, it is possible to have way more drug than its clearance pathway can handle, resulting in less drug than expected being eliminated. This is called saturated clearance. Saturated clearance is important to find in a dosing study as this can often result in higher than expected drug exposure compared to lower doses where the clearance pathways are not saturated.

A simple way to diagnose this would be to use a dose normalized plot. By normalizing your drug-time profile, i.e. divide all observed drug concentrations by their dose, you can see if the pharmacokinetic parameters are expected to be similar across doses when all the profiles overlap(no saturation), or if saturation has occurred when the profiles do not overlap.

Hope this was a useful tip!

Posted in Uncategorized | Tagged , , , , | 2 Comments

Direct vs Indirect effect models

When you take a drug, the drug needs time to be absorbed after, it needs to reach the effect site and then cause a biological process to happen before an effect occurs. All these processes take time. Some of them are fast, allowing us to model drug effect directly in relation to the drug concentration profile (direct effect model). Other effects, like the one we observe in caffeine, are slower, having a delay between reaching peak drug concentration and peak effect concentration, and require us to model its effect as an indirect effect model.

One of the interesting plots mentioned in the original caffeine PK/PD paper by RN Burns (DOI: 10.4236/pp.2014.54054) is this hysteresis plot mentioned in figure 1, correlating effect against drug concentration. This is a classic example of a diagnostic plot for indirect effect. In a direct effect model, a sigmoidal curve should appear instead (See figure in post. I used some arbitary PD parameters to generate these plots).

Other ways of testing for direct and indirect effect would be to simply test the model fits of both direct and indirect models on the data and observe which one results in a better fit and objective function value, as well as the magnitude of the Kdelay value which governs the delay effect.

Hope you learnt something this week too!

Posted in Uncategorized | Tagged , , , , | Leave a comment

How to build a PK-PD model?

Hello fellow coffee and cat lovers, as with the first caffeine simulator, I will be going through how to run PK-PD simulations too.

Link to coffee simulator 2: https://lnkd.in/dAiS3igB

We have previously covered how to run PK simulations which you can view in my blog here. https://lnkd.in/gRhA62_T

PK-PD models are an extension of that, where we derive a concentration-response relationship on top of the PK model to form our PD model.
For that, we need to measure the PD response over time. You can see this in the paper by RN Burns (DOI: 10.4236/pp.2014.54054), where they have measured both PK, and PD over a 4 hour period.

PD responses can be linked to PK through equations such as sigmoidal Emax, or slope (see picture). In this case, a slope was used as the caffeine doses tested did not reach a saturation point that would allow a sigmoidal Emax curve to be estimated. As caffeine’s effect was also a delayed one, i.e. we experience the benefits of caffeine a little later after we have drunk our coffee, an additional effect compartment was added as well to account for this delay.

The parameters of these PD equations are fit to the data to form our concentration-response relationship, and can then be used to model response at different concentrations.

Hope you learnt something in this post!

Posted in Coffee Simulator | Tagged , , , , , , , , | Leave a comment

Why do pharmacokinetic-pharmacodynamic (PK-PD) modeling?

It takes 2 hands to clap. Previously, in my first coffee simulator,  https://janicegoh.shinyapps.io/CoffeeSimulator/ we used a simple threshold to determine caffeine efficacy and toxicity. However, this efficacy alone does not tell us exactly how alert we will be with a coffee dose. It merely provides us with a binary yes/no about coffee efficacy. For a more accurate picture, we thus need a PK-PD model instead, where we can quantify the effectiveness of caffeine on alertness in relation to its PK.

Unlike PK whose output is relatively straightforward in terms of measuring blood levels as the output, PD readouts are highly dependent on the endpoint you are looking for. In this case, we are all interested in increasing our productivity on Linkedin, so I had to look for a model that described alertness levels with caffeine.

After scouring the literature, I finally found a caffeine PK-PD model that describes various mental states of alertness by RN Burns et al. (10.4236/pp.2014.54054). This was done by getting participants to rate their level of alertness on a visual analog scale to rate their energy levels from 0 – 100, where 0 would be a category of totally exhausted, and 100 a category of very energetic.

This model helps us to understand not only how much caffeine we get in a standard cup of coffee, but also what the average person experiences upon consuming a cup of coffee. Hope you enjoy playing with the new coffee simulator 2!

Link to coffee simulator 2:  https://janicegoh.shinyapps.io/CoffeeSimulatorWithFeelings/

Posted in Coffee Simulator | Tagged , , , , , | Leave a comment

Artificial sweetener choices – to absorb or not to absorb?

Artificial sweeteners are in the news again regarding potential new health risks. In particular, xylitol (a common artificial sugar) has been called into question as a prothrombotic (causing an increased risk of blood clots and thus stroke and heart attacks) in M. Witkowski et al.’s study https://doi.org/10.1093/eurheartj/ehae244. As a pharmacometrician, of course we need to evaluate how much xylitol is given in your standard soft drink, how much is absorbed, and for how long.

According to a 1973 dose ranging study on xylitol using 10 healthy men, (T Asano et al, PMID: 4696096)  Xylitol has variable bioavailability from 49-95% with no detectable plasma concentrations 1 to 2 hours after ingestion. This suggests that while xylitol is easily absorbed into the body, it is also cleared quickly. However, just xylitol’s pharmacokinetic profile alone might not be sufficient to claim it is safe. Before we conclude, we must consider its prothrombotic mechanisms and actual incidence risk linked to its consumption.

Note: I neither strongly support the use of artificial sweeteners, nor denounce them. But I do like to drink diet coke after I spent a long time studying in the USA.

Should artificial sugars then, be designed to be less easily absorbed so we lessen this risk of toxicity? It turns out, other artificial sugars have already been designed that way. Aspartame, sucralose and steviol for example, have poor bioavailability as they get metabolized in the gut or are not well absorbed (PMID: 27753624).  However, leaving these sugars in the gut can in turn cause diarrhoea and other forms of gastric discomfort as the high amounts of sugar and their metabolites in turn draw water from the intestines, making stool soft. In fact, this has become a treatment for constipation in the form of lactulose syrup, another artificial sugar that is poorly absorbed by the body.

Thus, this becomes a tricky balance in designing a sugar that is poorly absorbed by the gut, and being sweet enough that its quantity is insufficient to cause gastric discomfort.

Pharmacology concepts can be applied in food science too!

Posted in Uncategorized | Tagged , , , , | 1 Comment

A sticky situation

Researchers, if your compound

  • Has strong noncompetitive inhibition
  • Has an unusually steep dose response curve
  • Exhibits time dependent inhibition
  • Does not have clear structure-activity relationships

It’s not your next big hit. It could be an aggregator instead.

These are some general pointers for flagging out false positives when screening for new hits (B. Shiochet PMID: 16793529). As PK scientists, this is also highly applicable to us, especially in screening drug-drug interactions, where microsomes or recombinant CYP enzymes are commonly used. As both microsomes and recombinant CYPs present as micelles or free floating proteins in solution, they are also susceptible to this aggregation phenomenon, resulting in compounds being falsely flagged as potent inhibitors of CYPs.

Aggregators cause inhibition by causing enzymes and proteins in the reaction solution to clump together, making the enzymes unable to catalyze new reactions.  This in turn results in a strong inhibition, even when the compound in question does not impact the enzyme’s active site either via direct binding (competitive inhibition) or influencing the active site conformation by binding elsewhere on the protein (noncompetitive inhibition).

In reality, however, CYP enzymes are embedded on intracellular rough endoplasmic reticulum, making them much less susceptible to aggregation occurring when kept within intact cells and organs.

These aggregates can be identified via dynamic light scattering which helps us detect the actual clumps in solution, or via the addition of a mild detergent, which can break up the aggregate, allowing the enzyme to regain activity.

Understanding how to detect aggregators, which are in vitro artefacts, is thus important in order that we do not wrongly classify enzyme inhibitors, and thus drug-drug interactions.

*Like and comment if you got the twitter meme reference!

#Singaporepharmacometrics #tempweeklydoseofPK #drugdruginteractions

Posted in Uncategorized | Tagged , , , , , | Leave a comment

How do I know two drugs can be safely taken together? – understanding drug-drug interactions

In my previous life as a pharmacist, many patients used to ask if it was safe to take two medications they were prescribed together. Unless otherwise stated e.g. explicit instructions were given to take the medications at least 2 hours apart, or if you take drug A not to take drug B as well, the medications prescribed are generally safe to be taken together. This is because the pharmacist has already checked for potential drug-drug interactions (DDI) before filling the prescription.

Similar to one of my previous posts on pipagao-drug interactions , there are broadly 2 categories of DDI

  1. Pharmacokinetic (PK) DDI – drug A influences drug B’s levels in the body when both are taken together e.g. an antibiotic ciprofloxacin increases high cholesterol medication, simvastatin’s levels, by inhibiting liver enzymes that break simvastatin down. This leads to a higher risk of side effects from simvastatin.
  2. Pharmacodynamic (PD) DDI – drug A has additive, antagonist or synergistic impact on drug B’s effectiveness/toxicity e.g. alcohol and sleeping pills can be a dangerous combination as alcohol increases the drowsy effect of the sleeping pill exponentially.

However, not all DDIs are bad. DDIs can also be used to improve therapy.

For PK DDI, a well-known example is Paxlovid which is used to treat COVID-19. Paxlovid is actually a combination of 2 drugs, nirmatrelvir and ritonavir. While both are antivirals, ritonavir has the additional effect of inhibiting liver enzymes that break down nirmatrelvir, allowing nirmatrelvir to stay longer in the body and exert its antiviral effect.

For PD DDI, we similarly have a common example with Augmentin, a broad spectrum antibiotic often prescribed for bacterial (not viral) infections. Augmentin is also a combination medication of amoxicillin and clavulanic acid. Amoxicillin by itself is useful for killing bacteria. However, it can be easily inactivated by an enzyme called beta-lactamase, which are produced by several bacterial strains. Clavulanic acid is a beta-lactamase inhibitor and thus helps amoxicillin to become effective against these beta-lactamase producing bacteria.

DDIs are thus not always things to avoid, but require good pharmacological knowledge to steward well for safe and effective therapies. But as always, when in doubt, just ask your pharmacist!

Posted in Uncategorized | Tagged , , , | Leave a comment

What are enteric-coated tablets, and how does enteric coating affect PK?

Most tablets and capsules taken by mouth enter the stomach and dissolve there, before entering the small intestine for absorption. On the other hand, enteric-coated tablets are designed with a special coating to allow the medication to pass through the acidic portion of the stomach without disintegrating, before breaking down only in the small intestine.

A good example of this is omeprazole, a common medication for acid reflux AKA heartburn. Despite omeprazole reducing acid in the stomach, it is acid labile and would get destroyed if exposed to stomach acid before it reaches the intestine. Hence an enteric coating is required for omeprazole to reach the small intestine for absorption and retain its efficacy. This is why omeprazole packaging comes with do not crush or chew labels, as that can destroy the enteric coating.

The enteric coating can change the drug’s concentration-time profile too. As the tablet only disintegrates in the small intestine instead of the stomach, this reflects as a lag time before we start detecting drug being absorbed into the blood.  Depending on the type of formulation, the rate of release of omeprazole may also differ and impact the overall absorption rate of the drug. (see attached figure from Mostafavi SA et al. https://www.researchgate.net/publication/286716167_Relative_bioavailability_of_omeprazole_capsules_after_oral_dosing#fullTextFileContent) We can use either a transit or a lag compartment to model this delay in absorption. This allows us to capture the actual absorption process, while accounting for the effect of the enteric coating.

For those interested, there are differences between choosing a lag versus a transit compartment. You can read more about it here. https://www.page-meeting.org/page/page2004/savic.pdf  Ultimately, I generally go with the choice that describes the data the best.

Posted in Uncategorized | Tagged , , , , , , , | Leave a comment