How can I use PK to help my research or clinical practice? (Part 5/5)

Thank you all for staying with me throughout this series! It has been fun sharing about my field with all of you!

Over the past few weeks we have played with, and discussed the principles behind the coffee simulator, and how it was made. In summary, we have covered, (each point corresponds to a post, which you can find in my profile)

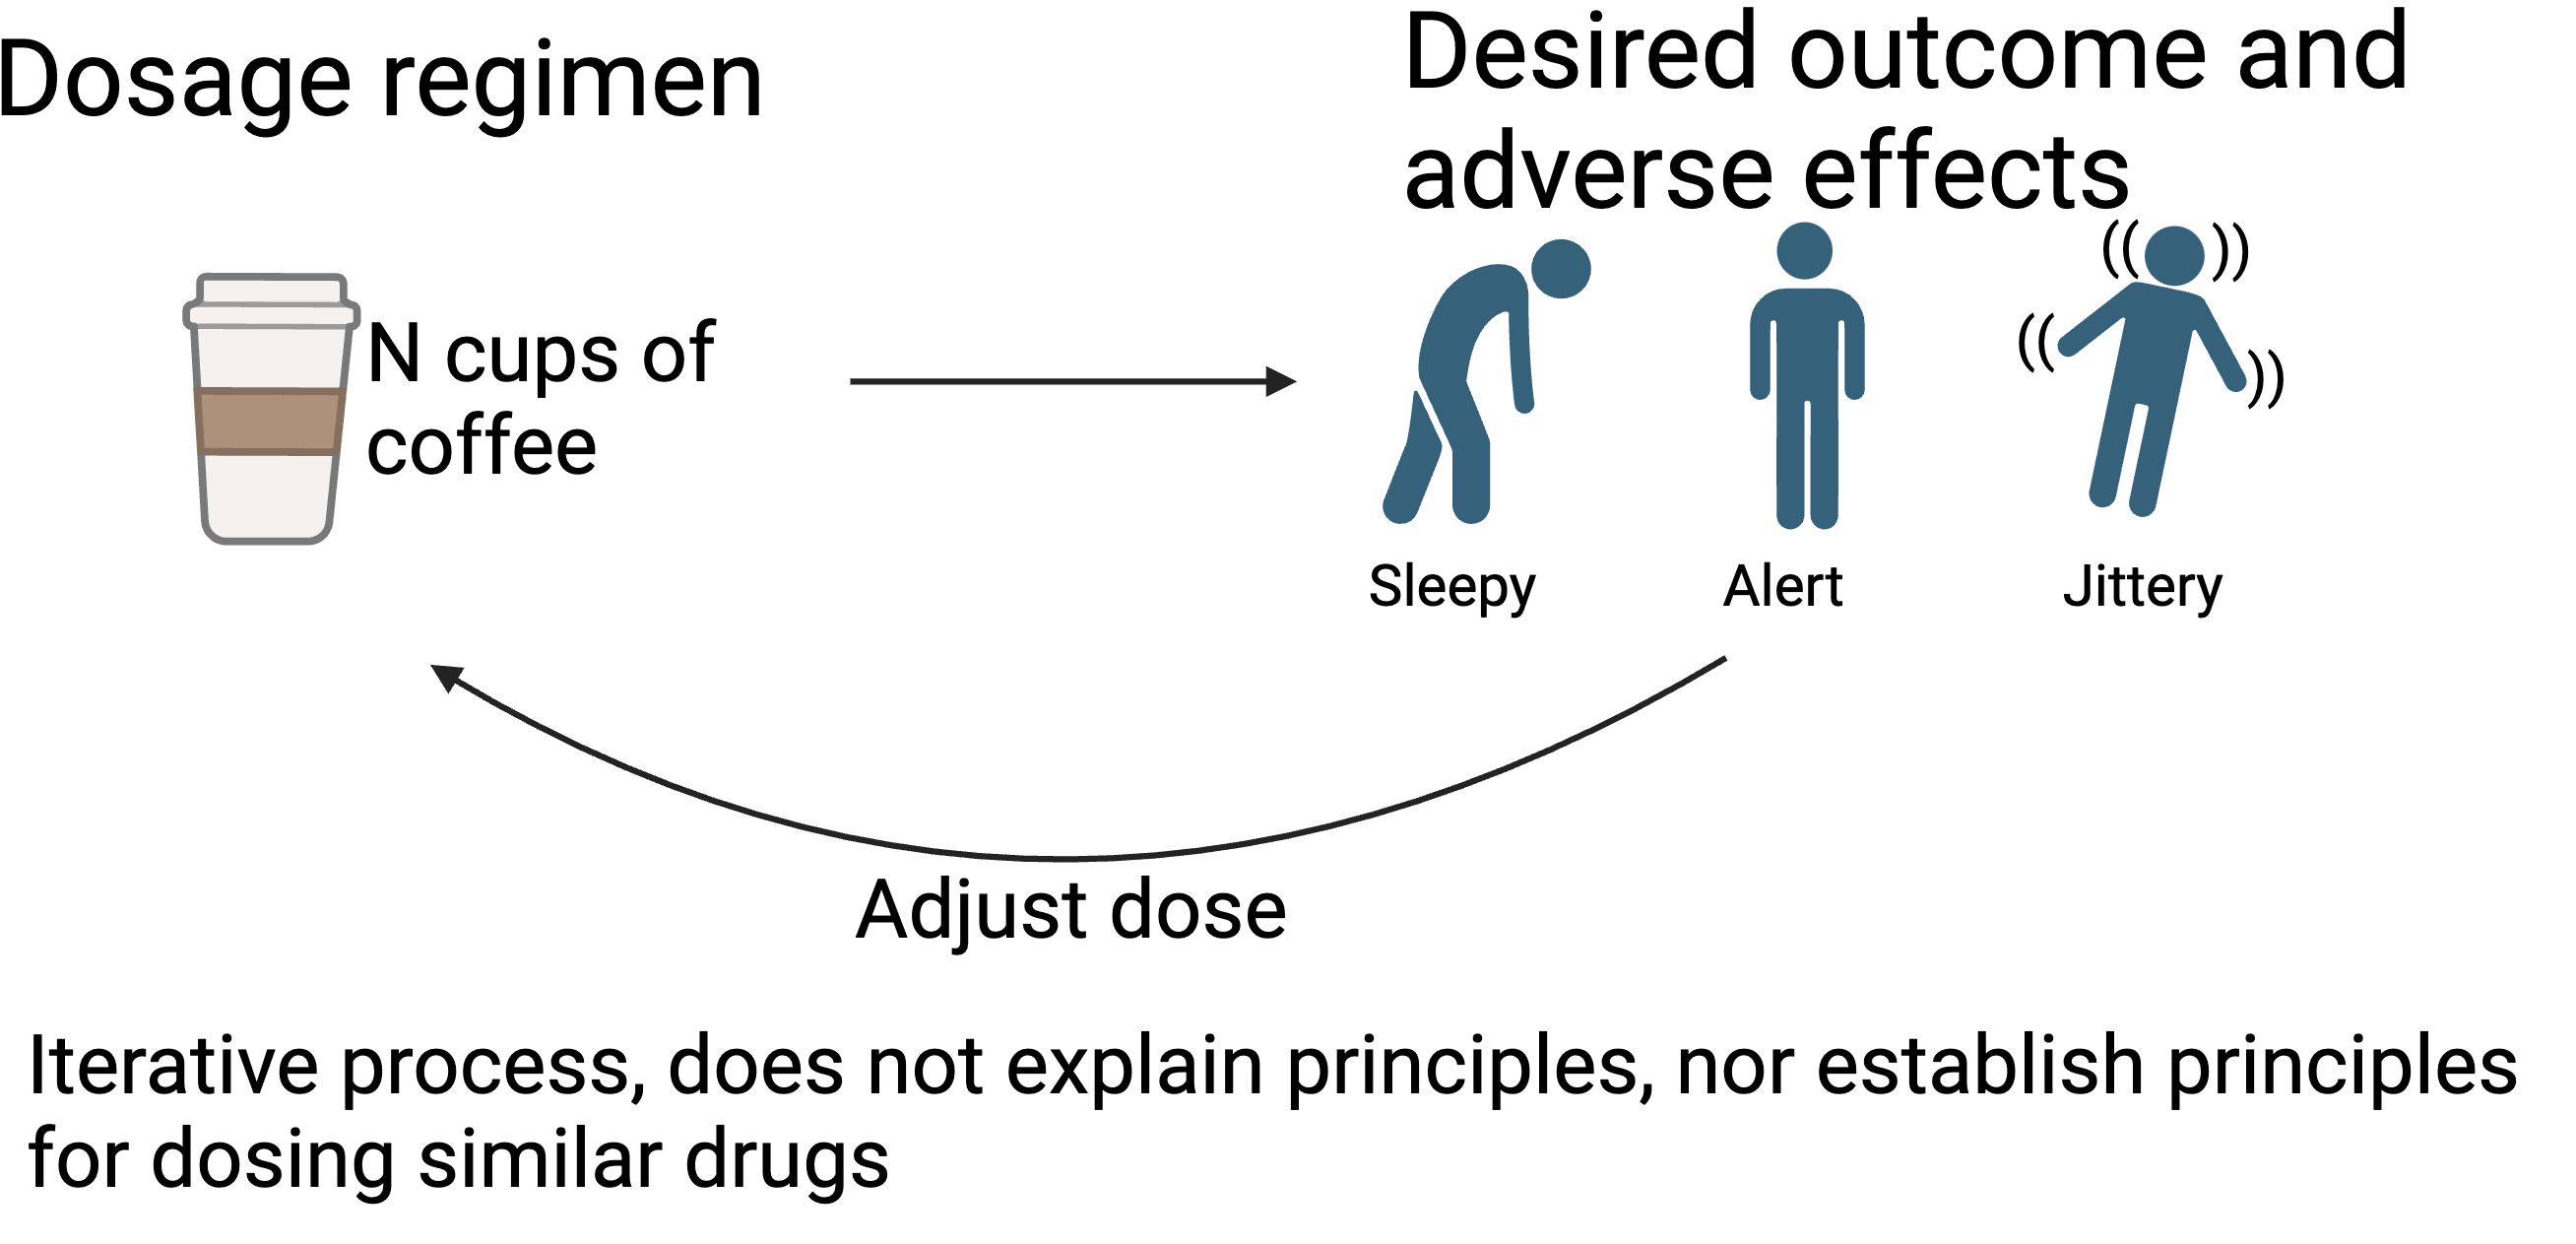
  1. How modeling and simulation is useful to create rules for understanding efficacy and/or toxicity
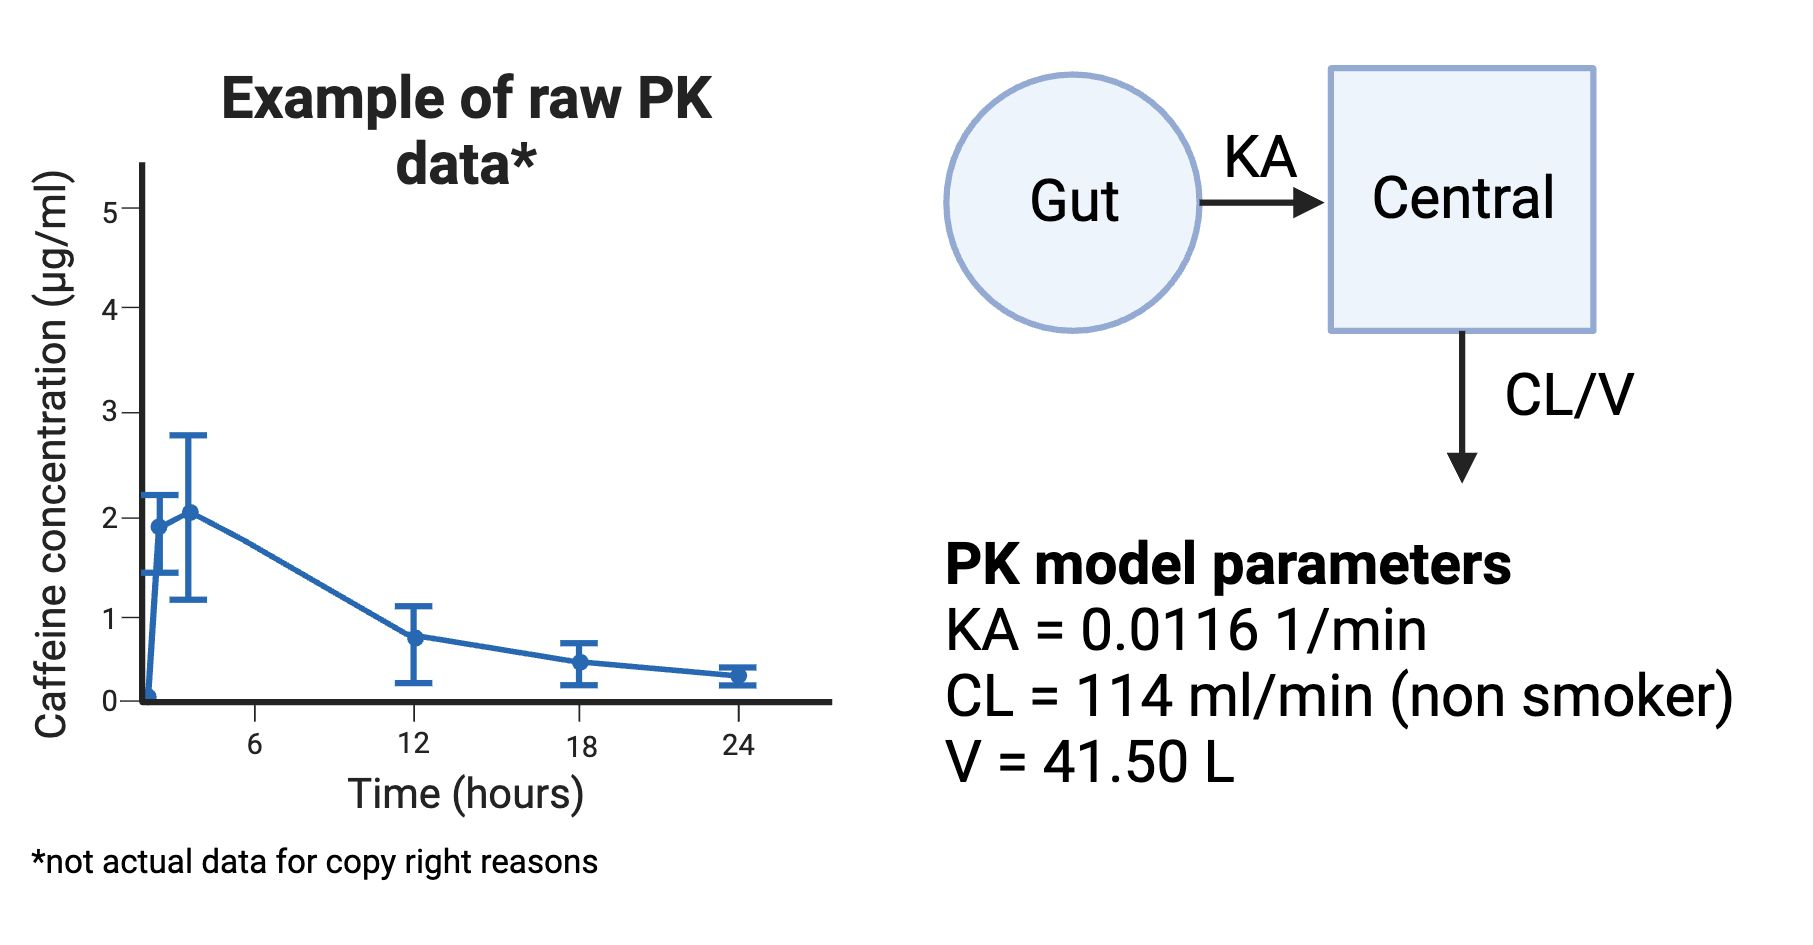
  2. What kind of data is needed to build such a model
  3. How to build your own simulation using PKPDsim in R
  4. How to do rigorous testing for which factors influence variability in a drug profile the most

 I had a lot of fun creating the app and discussing it with all of you! As our last topic for today, I wanted to share some real world examples too of how PK has been used.

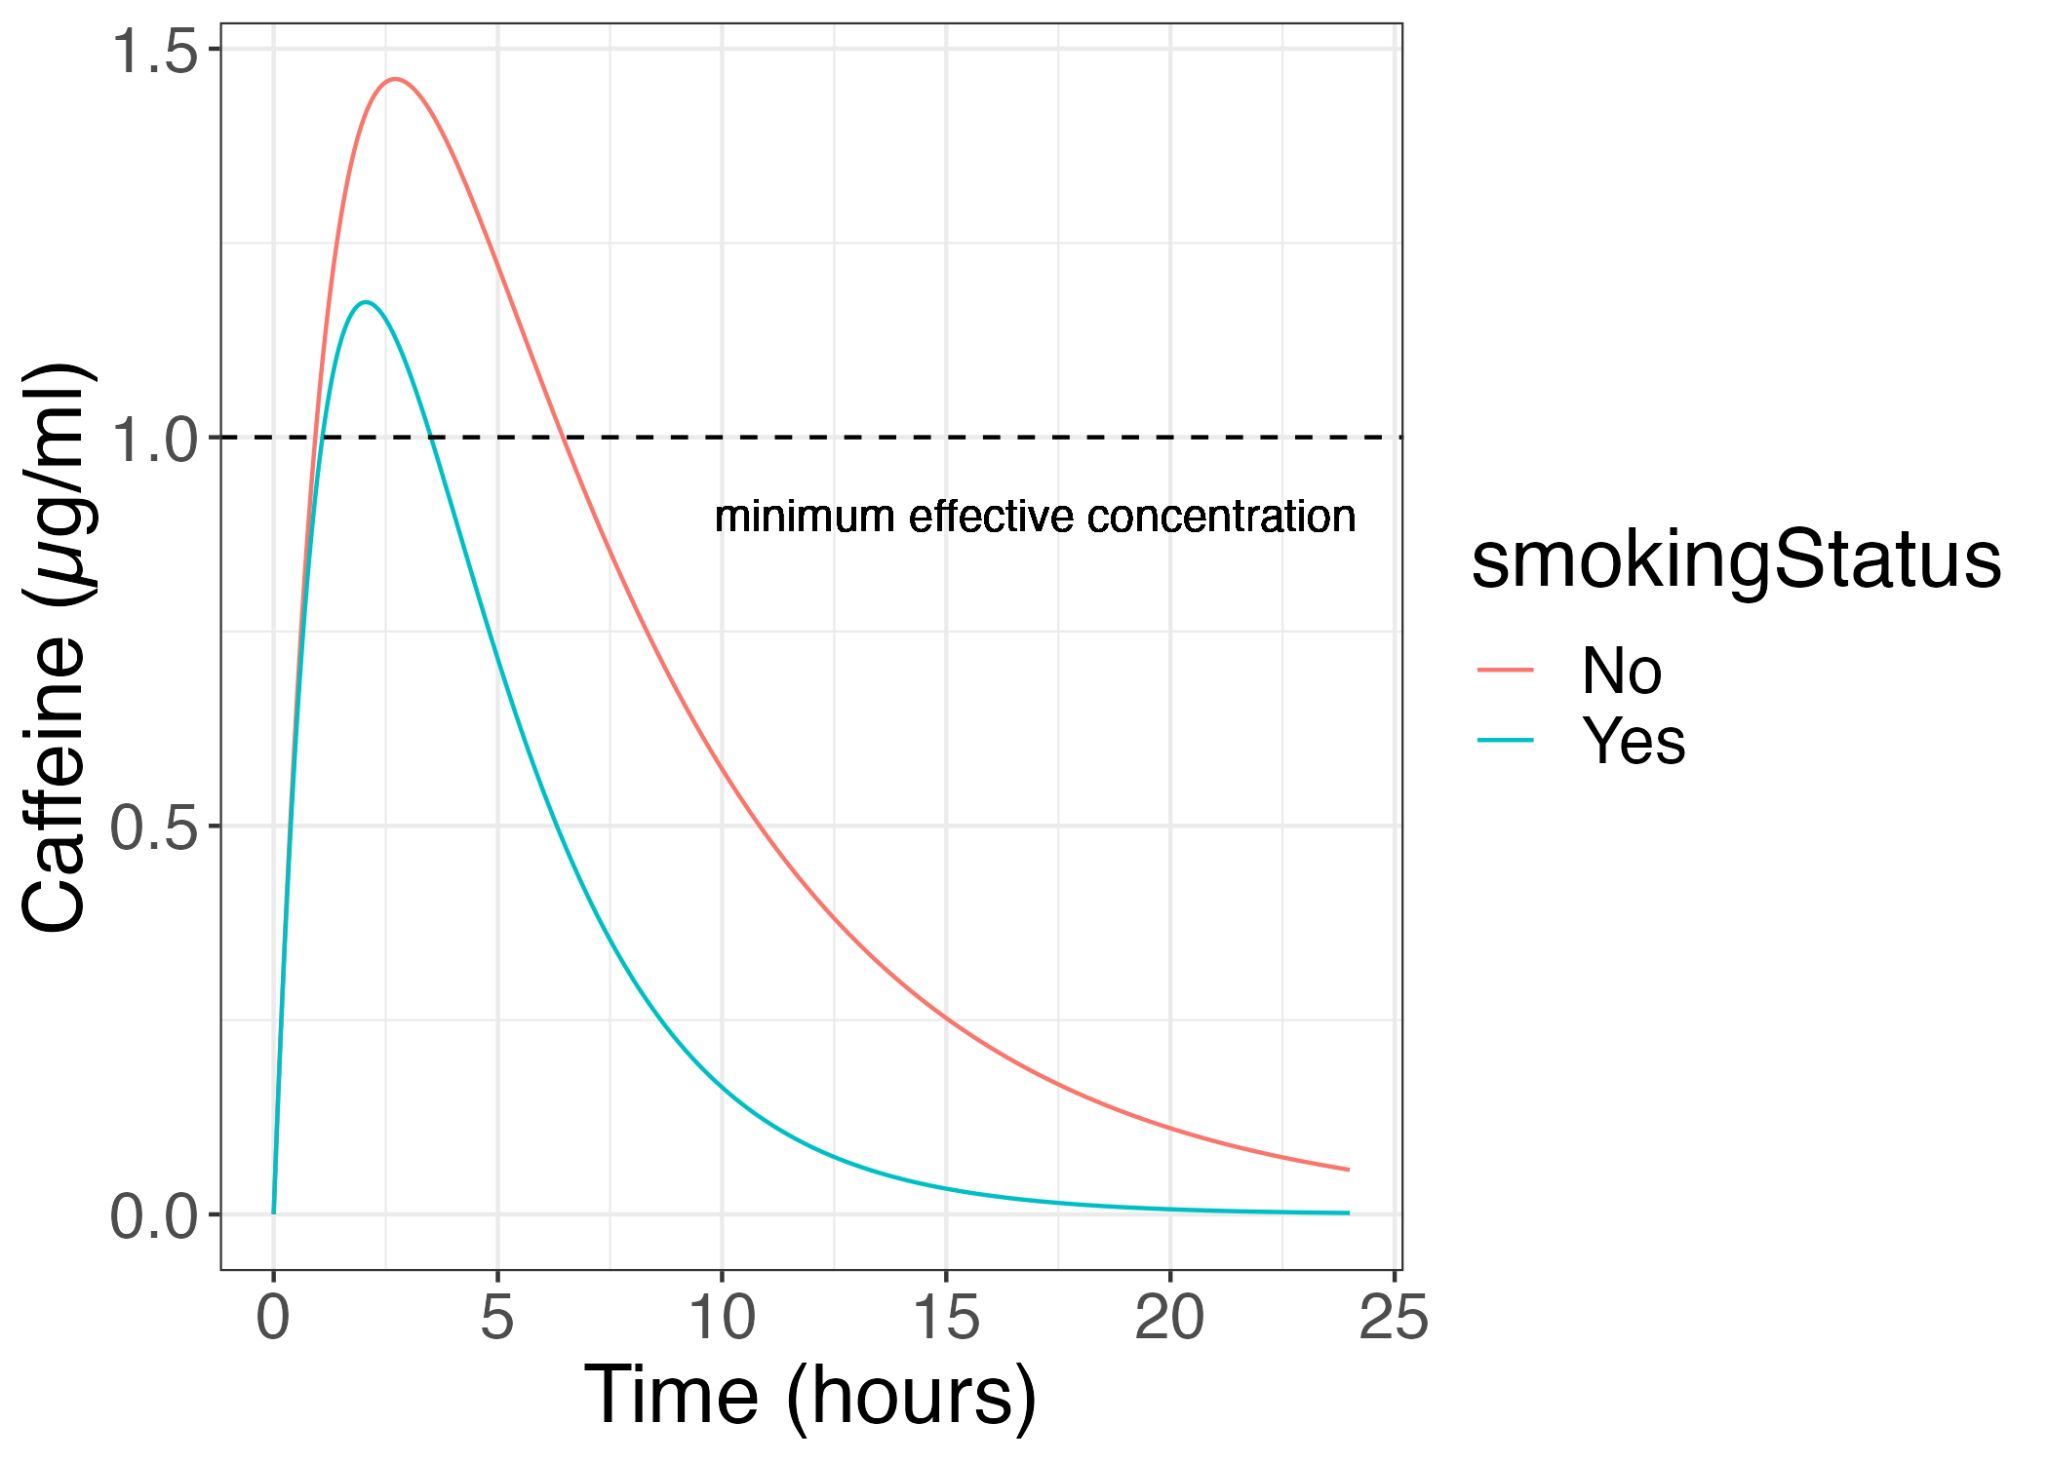
  1. Optimizing drug dosing for drug with narrow therapeutic windows

Drugs such as vancomycin (a potent antibiotic for severe infections) have a narrow therapeutic window but very variable PK based on a patient’s kidney function. Using PK models, we can help to recommend the appropriate vancomycin dosing such that patients can still be cured of their infection while reducing their chances of serious side effects such as hearing loss. An increasing number of hospitals are engaging pharmacometricians to help them design such dosing algorithms for their patient populations. Here is an example of an open source one https://pubmed.ncbi.nlm.nih.gov/35353046/

  • Understand site of action bioavailability

Very often PK studies are done using plasma drug concentrations. However, plasma drug concentrations may not always be reflective of the actual amount of drug the disease site needs to receive. This is often a problem when we need to treat organs that are hard for drugs to penetrate, such as the brain, or, when the disease site does not have good blood flow, e.g. solid cancer tumors or tuberculosis lesions. Getting drug concentrations from these sites are often a lot trickier and more sparsely sampled. PK models can help us to better understand this drug penetration into the target site and simulate the drug dose needed for adequate exposure at the site of action.

Natasha Strydom has a nice paper detailing how to study drug penetration into TB lesions using a PK-PD approach. https://pubmed.ncbi.nlm.nih.gov/30939136/ This paper also has a RShiny app to play with! http://saviclab.org/tb-lesion/

  • Tailoring drug dosing for special populations

Special populations often consist of people who are not as easily studied, such as pregnant women or children. However, we cannot simply assume that such populations will handle drugs the same way as our general healthy adult population.

This study by Jordan Brooks shows how we can use popPK to better dose tacrolimus for our paediatric cancer patients. https://pubmed.ncbi.nlm.nih.gov/34950026/

  • Translating preclinical observations to clinical outcomes to help with dose recommendations

Understanding drug PK in different preclinical models such as mice, coupled with drug efficacy in these models can be used to determine an exposure-response relationship that is translatable from these mouse models to human trial outcomes. 

Here is an example https://erj.ersjournals.com/content/early/2023/06/08/13993003.00165-2023

There are many other applications out there! Feel free to share your own applications or interests too in the comments. Now its time for me to take a quick break and relax with a cup of coffee.

Posted in Coffee Simulator | Tagged , , , , , , , | Leave a comment

What about variability? (Part 4/5)

Let’s talk about variability. Many of you have correctly highlighted over the past few weeks that coffee absorption can be variable due to a variety of reasons. This not only occurs with coffee but with almost all drugs that we have on the market. The levels reported in the coffee simulator are based on a population average, meaning, this is the typical profile of the population that describes the data across all 59 individuals in the study best. To understand variability, we often test for covariates (independent variables that can influence the outcome). Knowing which covariates significantly affect our drug profile is important so we know which groups of people need dose adjustments.

Covariates that we often test for include things such as age, weight, gender and genetic makeup. If you noticed in the app, there was an option for smoker or non smoker. This was the most significant covariate in the study. If you toggle between smoker and non-smoker, you will see that smokers tend to have a much lower caffeine concentration compared to non-smokers. This means that to get the same amount of benefits as a non-smoker, smokers will need to drink more coffee.

Now, this post is not meant to discuss the pros and cons of smoking. How exactly the paper arrived at this conclusion is purely a data-driven one. In this study, age, weight, history of regular caffeine consumption and smoking status were collected as participant information alongside the caffeine PK data. A base model, which describes the typical population PK profile is first built to get PK parameters such as rate of absorption (KA), clearance (CL) and volume (V). After, each of these covariates are tested against each of the parameters in a step-wise fashion, and the covariates that help explain PK variability the best are highlighted as significant covariates to be included in the model. This is usually evaluated as a drop in the objective function value (OFV), a measure of how well the model explains the data. The combination of covariates that caused the largest statistically significant drop in OFV is then selected as the model covariates. In the caffeine paper, smoking status alone resulted in this drop, while age, weight and caffeine consumption did not improve the model significantly. Hence we have an option for smoking and non-smoking in the app!

If you would like to go more in depth into understanding and modelling covariates, Prof Nick Holford has a good set of slides on the topic you can access here https://holford.fmhs.auckland.ac.nz/docs/principles-of-covariate-modelling.pdf

Stay tuned for our last and final part of this series where we discuss various real life applications of PK modelling!

I would love to hear from you too about topics you might want me to discuss, so leave your suggestions in the comments!

Posted in Coffee Simulator | Tagged , , , , , , , , , | Leave a comment

A guide to running your own simulations (Part 3/5)

A huge aspect of building PK models is simulation, so we can test new scenarios, optimize new dose regimens, and even combine it with a pharmacodynamic (PD) model to build PK-PD models (maybe a future topic? Comment down below).

You too, can build your own PK model with some basic coding skills. Here are 3 steps to do so.

  1. Get a PK model and its parameters

If you are interested in doing simulations for a new drug, you will have to collect the PK data and build the model too (more details in post 2). However, for drugs already on the market, it is likely that someone has already built a model and published it. Just by searching “Drug Name population PK” in Google, I have been able to find relevant model parameters for my work. Most papers would report their parameters in a table, usually in the results section.

  • Code your model up in PKPDsim

There are multiple ways of coding this up. In my case, I am using R and RStudio to build my caffeine model, with the bulk of my code depending on the PKPDsim package done by the amazing Ron Keizer. PKPDsim has made simulations in R much easier.

You can check out his youtube tutorial here https://www.youtube.com/watch?v=9JNW3YZ3f9k

And his github here https://github.com/InsightRX/PKPDsim

  • Specify your regimen and simulate your model

Using PKPDsim, you can code up multiple different regimens, using different doses, times, and intervals. Using the specified model, parameters and regimen, PKPDsim can generate a dataframe containing the simulation. You can then plot this out in R. I like to use ggplot to do this.

Hope this was helpful and do let me know in the comments if you did try it out too!

Stay tuned for part 4 where we discuss understanding variability in a drug profile

Posted in Coffee Simulator | Tagged , , , , , , , , | 1 Comment

What is the coffee simulator based on? (Part 2/5)

The main backbone of the coffee simulator comes from a pharmacokinetic model detailed in this paper by KY Seng et al. https://pubmed.ncbi.nlm.nih.gov/19125908/

Interestingly, there are a lot of papers related to caffeine out there for various purposes, such as defense science and sports science! There are a ton of models too, on dosing caffeine in premature infants to treat apnea by simulating the respiratory system, which is particularly useful, as getting data in such young children is often difficult. In our case, we used a model built by the Defense Science Organization (DSO), Singapore to make our app.

DSO first had to give known doses of caffeine to their 59 healthy volunteers and collect serial blood samples from them over a period of 24 hours. The full details of their dosing regimens are listed in the paper. After, caffeine concentration from these blood samples are quantified on a LCMS machine. By plotting these data points over their collection time, we now have 59 individual PK profiles of caffeine from these volunteers.

The raw data is very informative, as from it, we can tell how fast caffeine is being absorbed and cleared. If we know things such as a therapeutic window, we can also tell how many people got the desired benefits using the caffeine doses reported in the study.

To take this information further to simulate new scenarios, we then need to build a PK model. In this case, we are using compartmental models (see picture) which describe the fate of a drug in the body by dividing the whole body into one or more compartments. While the compartments are not always linked to actual organs directly, we can use these models to mathematically describe what the body does to the drug in terms of absorption (KA), distribution  (V), and clearance (CL). We can then use these parameters to simulate new scenarios like what many of us have done with the coffee simulator.

Stay tuned for part 3 where I share how you can run simulations in R too!

Posted in Coffee Simulator | Tagged , , , , , , , , , | Leave a comment

Optimizing your coffee dosage – why use modeling and simulation? (Part 1/5)

Hi all, here is a series I originally posted on linkedin as a soft introduction to the wonderful world of pharmacometrics. A lot of these posts revolve around a simple coffee simulator I built for the fun of optimizing your coffee dosage. Hope you enjoy learning as much as I did making this series!

Link to coffee simulator: https://sites.google.com/view/singaporepharmacometrics/apps

With or without my coffee simulator app, most of you would have already optimized your own caffeine dose after some trial and error. After all, it is easy to individualize the dose by just figuring out when you would be sleepy and decide to take another cup. However, as modern-day philosopher Marshall Mathers once said, “You don’t get another chance, life is not Nintendo game.” For many other drugs, such an iterative process can be highly detrimental if a safe and efficacious dose is not found quickly.

Knowing the pharmacokinetic profile of a drug allows us to establish rules on how the dosing should be conducted. i.e. we know how fast the drug is absorbed and eliminated, so we know how often to dose such that we can achieve drug levels above a particular concentration of the drug.

These models also help us to test covariates such as age, gender and pharmacogenomics (that a number of you mentioned previously) to understand where variation in a population can occur. In the case of our caffeine model, the developers of the model found that clearance of caffeine was significantly faster in smokers than nonsmokers, hence the additional option of smoking status.

Modeling and simulation thus helps us to characterize the drug’s exposure in our body and optimize safe and efficacious doses with much less trial and error required.

Posted in Coffee Simulator | Tagged , , , , | Leave a comment