
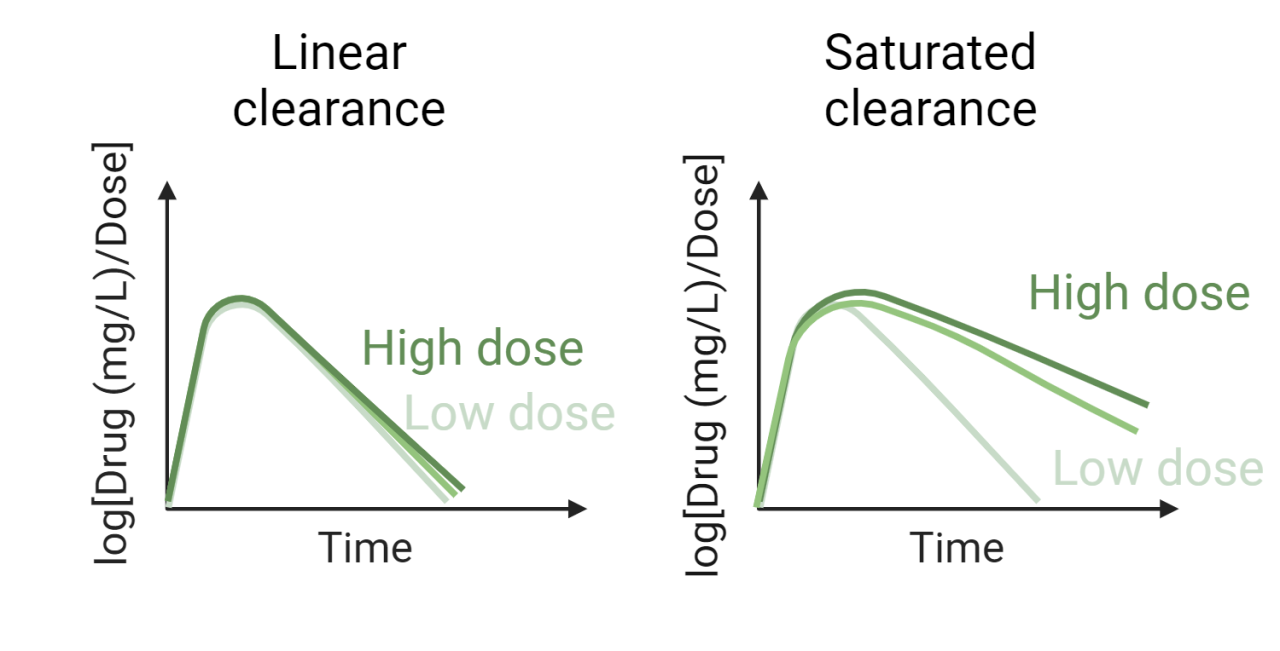
In many animal studies, a wide range of doses are often used. At high doses, it is possible to have way more drug than its clearance pathway can handle, resulting in less drug than expected being eliminated. This is called saturated clearance. Saturated clearance is important to find in a dosing study as this can often result in higher than expected drug exposure compared to lower doses where the clearance pathways are not saturated.
A simple way to diagnose this would be to use a dose normalized plot. By normalizing your drug-time profile, i.e. divide all observed drug concentrations by their dose, you can see if the pharmacokinetic parameters are expected to be similar across doses when all the profiles overlap(no saturation), or if saturation has occurred when the profiles do not overlap.
Hope this was a useful tip!

Hello. I just want to know if we can find the dose at which saturation occurs from this profile. Anyways love the way you try to explain these
Hi! What I explained above is a simple visual check. To find actual saturation parameters you need to fit the saturated clearance equation into your model as Vmax*CP/(KM+CP)